Andesight本身有target manager可以管理target,
啟動target,並且debug時會自動連到對應的port。
如果ICEman是在外面用console啟動,
在Andesight裡debug要怎麼做呢?
下面詳述方法:
(1)啟動ICEman
Attachment:
 a.png [ 6.95 KiB | Viewed 7874 times ]
(2)在target上按右鍵,選單上點擊Debug As/Debug Configurations...
Attachment:
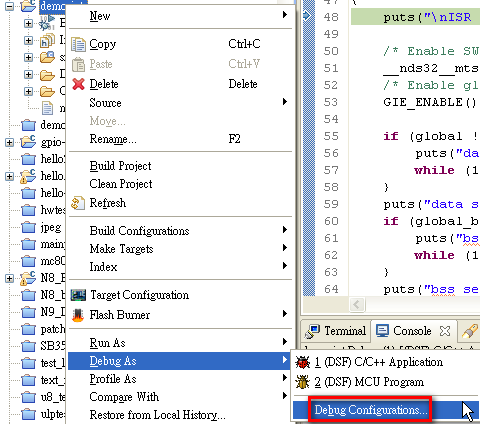 b.png [ 22.95 KiB | Viewed 7874 times ]
(3)請將Target Management Service前方的方塊取消勾選
Attachment:
 c.png [ 14.07 KiB | Viewed 7874 times ]
這裡示範的是C/C++ Application Debug,
MCU Debug亦有相同的按鍵,也有相同的功能。
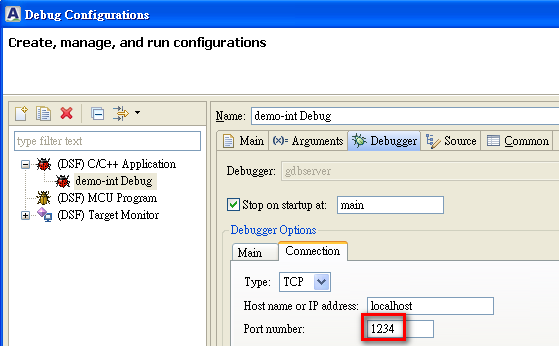
(4) 切到Debugger/Connection
填入剛才啟動的ICEman的port number。
Attachment:
 d.png [ 16.53 KiB | Viewed 7874 times ]
(5) 按下Debug可以開進入Debug session。
Attachment:
 e.png [ 34.81 KiB | Viewed 7874 times ]
與一般的debug畫面相同。
Attachment:
 f.png [ 20.73 KiB | Viewed 7874 times ]